DataLeading Analytics lets you mix, match, and analyze data from any digital point in the customer journey.
With in-depth analysis, versatile reporting, and predictive intelligence, you get the insightful foundation
you need to build better customer experiences.
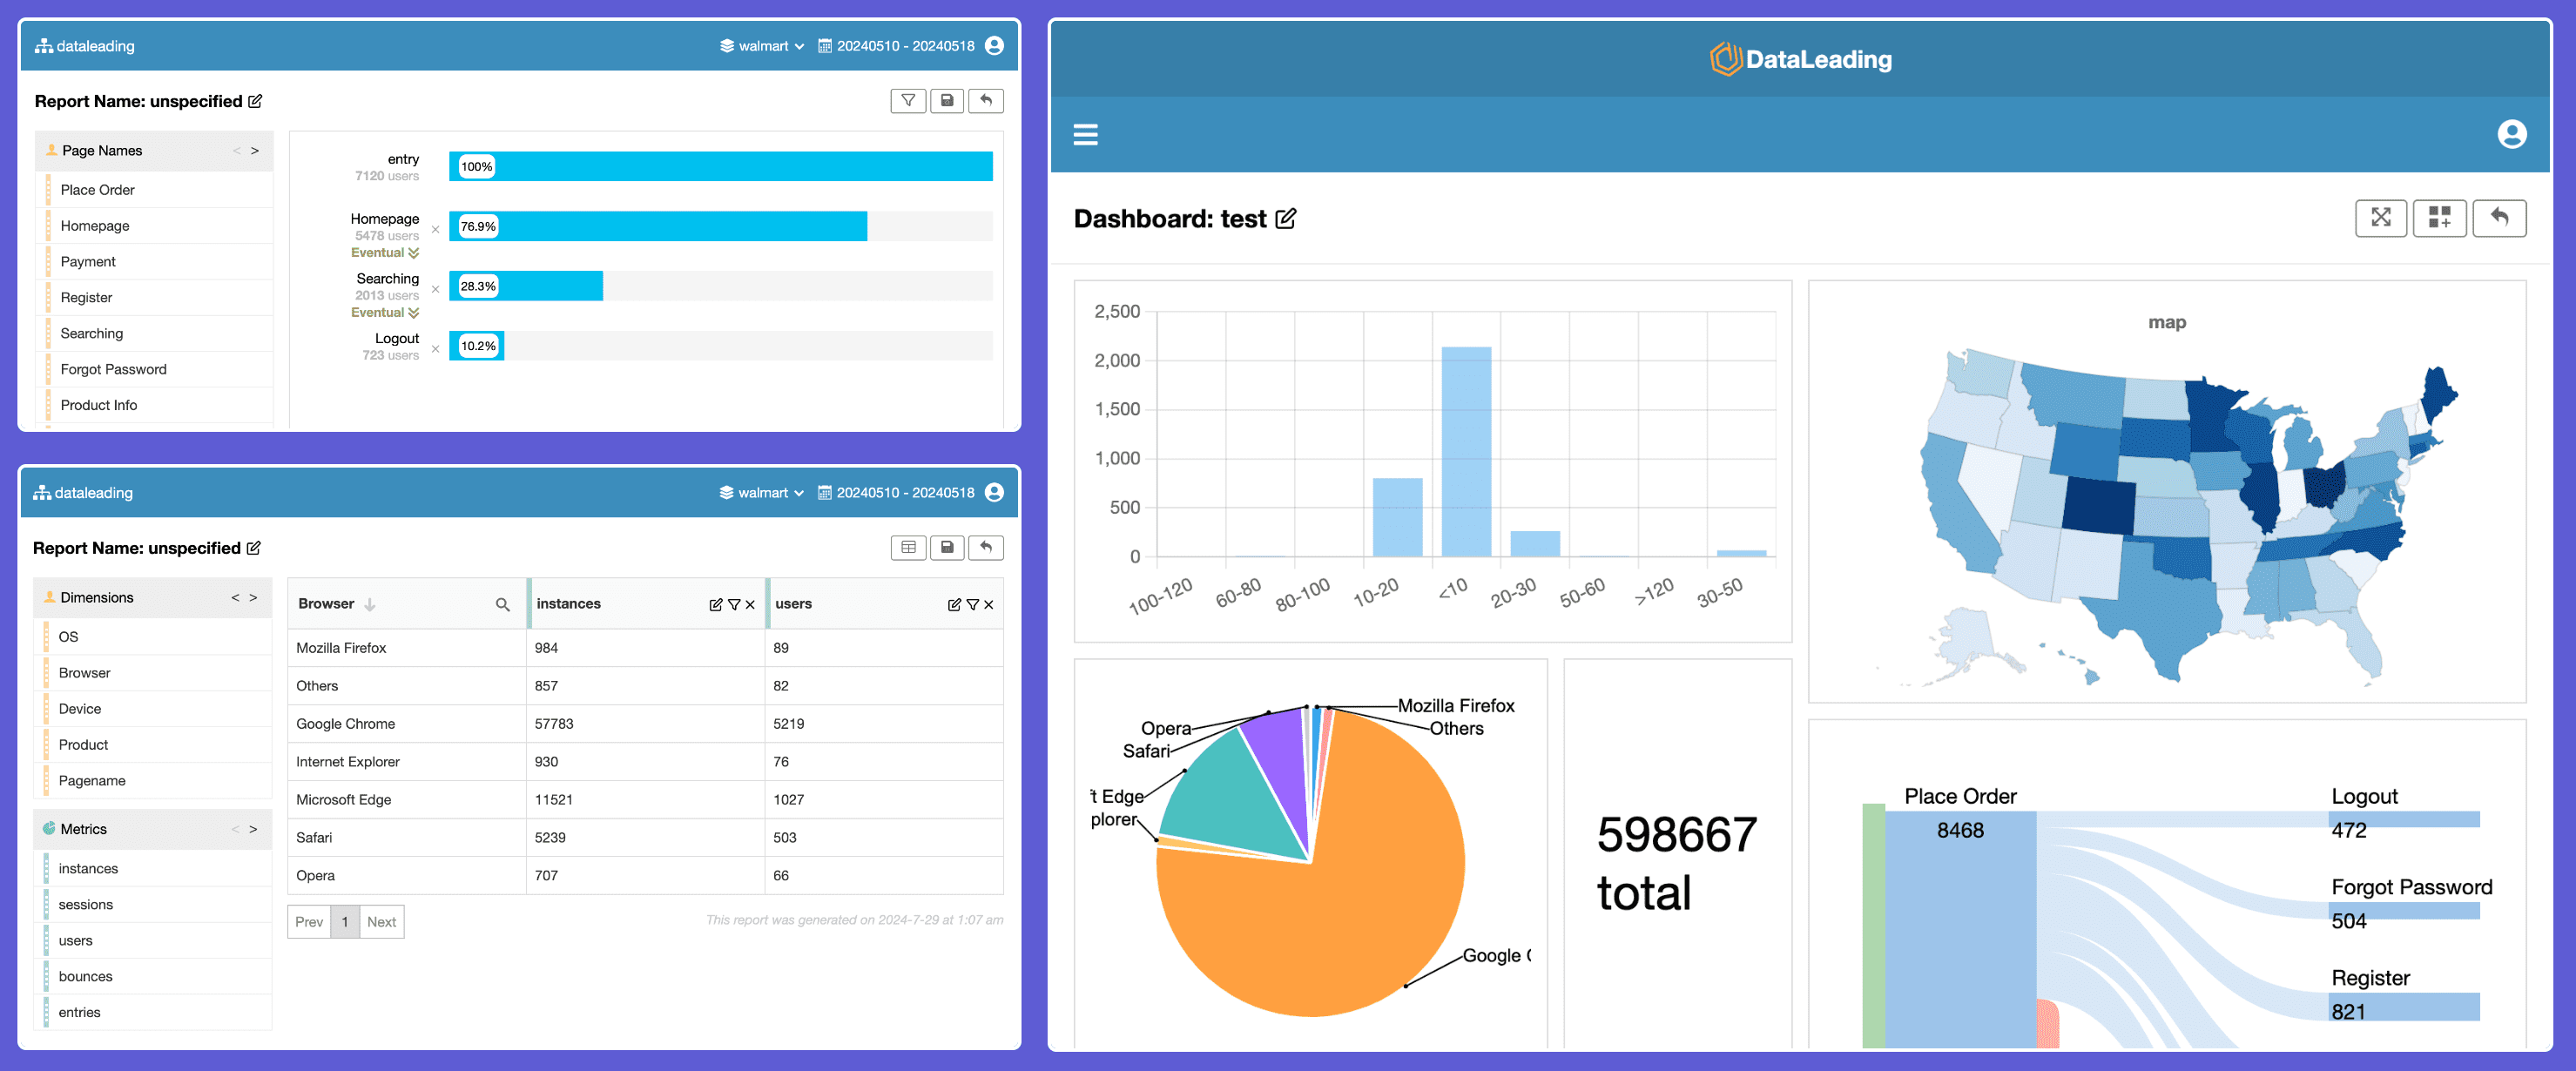
Quickly analyze by drag and drop dimension,metric, and filter to create a custom table.
Map lets you build a visual map of any metric.
Funnel reports show where visitors left and continued through a sequence of pages.
A histogram is similar to a bar chart, but it groups numbers into ranges.
Venn lets you drag in up to 3 filters and one metric to build a Venn diagram..
Flow analyze where customers go before and after specified checkpoints.
A cohort is a group of people sharing common characteristics over a specified period.
Shows total number for a metric in a specific dimension and filters.
Get started for free
We’ll get you started on a 30 day trial and $300 credits to spend at your own pace.